The National Travel Survey (NTS) is a household survey of personal travel by residents of England travelling within Great Britain, from data collected via interviews and a 7-day travel diary, which enables analysis of patterns and trends. This release covers the main findings from these travel behaviours during 2023. During 2023, there were no longer any restrictions due to the pandemic, therefore these trends offer an insight into how personal travel compared to 2019.
View the active travel NTS statistics here
Average trips made by people living in England have increased by 6% in 2023 compared to 2022, however, trip rates remain lower than in 2019 (-4%) with 915 trips made on average in 2023.
There were increases in trip rates amongst private transport modes (such as car drivers, car passengers and motorcycles), and public transport modes (apart from buses in London which have remained similar to the previous year) in 2023. Trip rates for active transport modes such as walking and cycling have remained similar in 2023 compared to 2022. Trip rates for all transport modes were however still lower than 2019 (pre-pandemic) apart from walking and motorcycle trips.
This includes 22 minutes per cycling trip, 21 minutes per car driver trip and 18 minutes per walking trip, on average in 2023.
Walking trips continued to show an increase of 5% compared to 2019 levels with 263 walking trips per person in 2023, similar to 2022 (267 trips per person).
Where more than one transport mode is used within trips, 60% of these trips began with walking in 2023. Nearly all walks recorded in the NTS were under 5 miles in 2023 (99.8%). Most trips to and from school for trip length of under 1 mile were made by walking (80% for children aged 5 to 10 and 89% for children aged 11 to 16) in 2023.
Average walking distance travelled was the highest on record since 2002 with 225 miles per person. In 2023, females of all ages made more walking trips on average and walked a greater distance than males, with the age group 30 to 39 making the most walking trips with 327 trips per person.
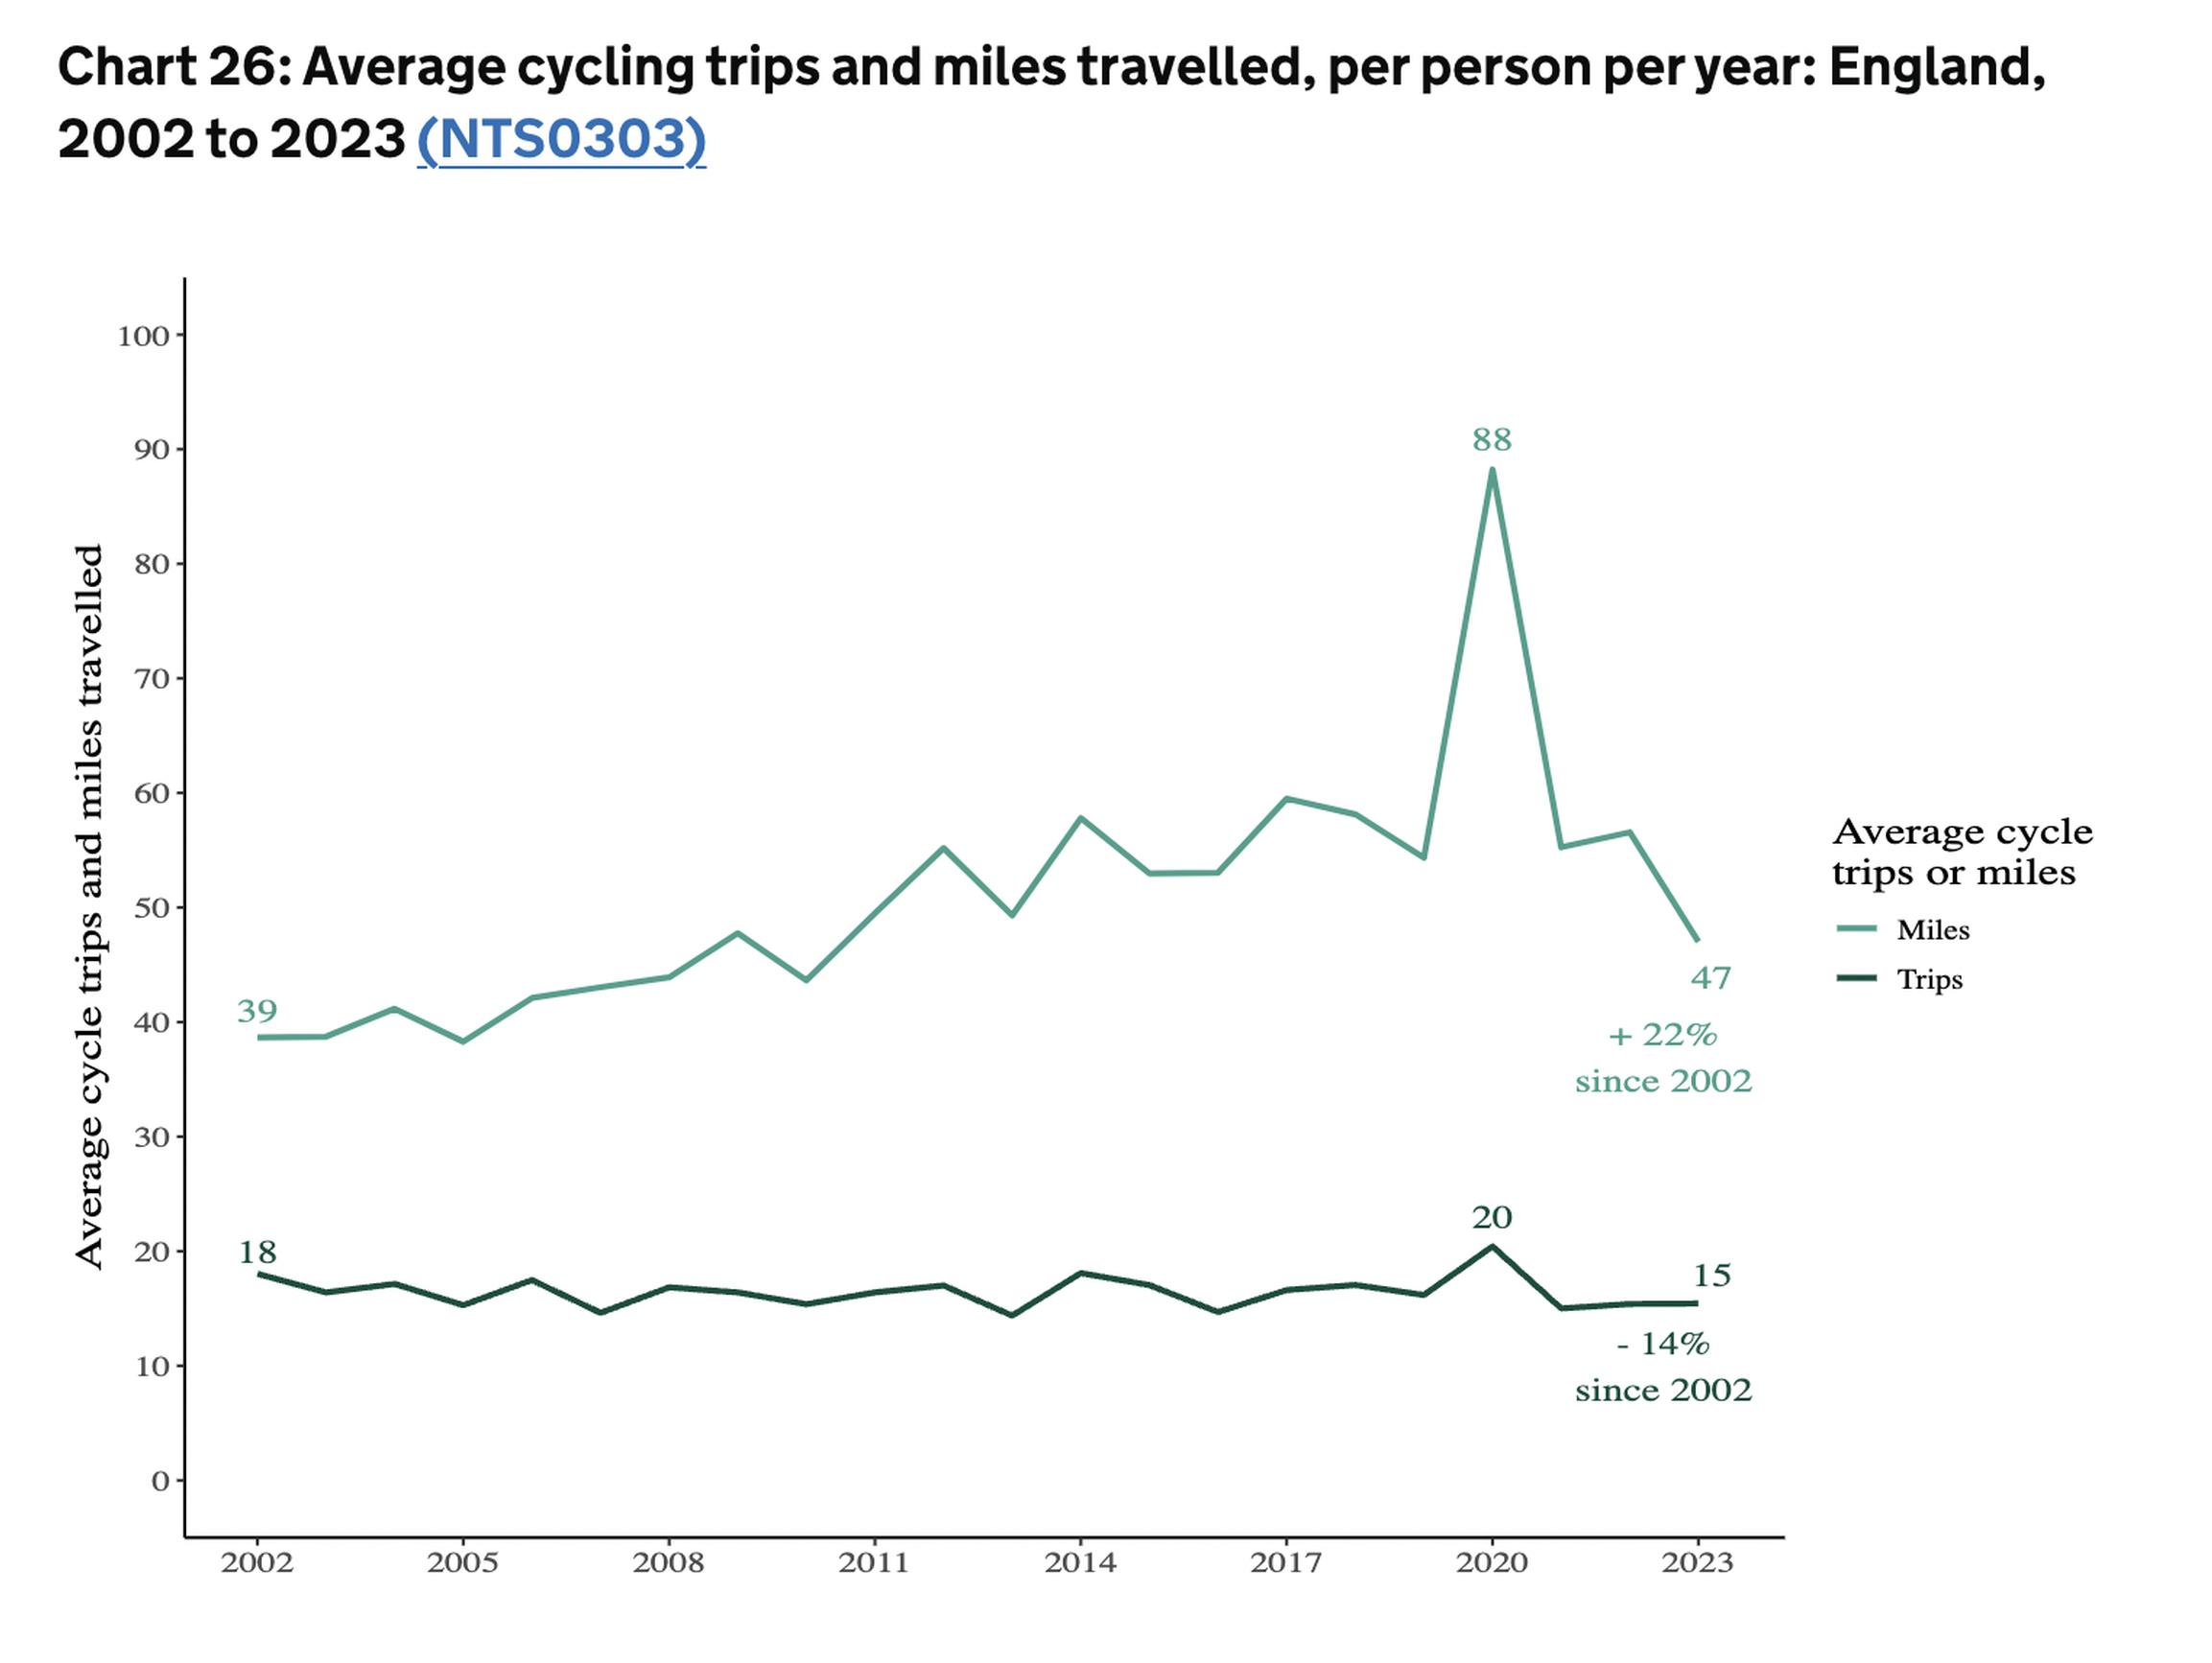
There was a general upward trend in the average cycling miles travelled from 2002 to 2019 followed by a sharp increase in 2020, but these levels have since fallen in 2023 to levels last seen in 2013.
Cycling trips made up 2% of trips and 1% of distance travelled, on average in 2023.
Cycling trip rates remained broadly similar between 2002 and 2023, with a slight increase shown in 2020. In 2023, there were 15 cycling trips per person, similar to the previous year (15 trips per person). There were 16 cycling trips per person in 2019. The relatively small number of cycling trips in the sample means that this series can be volatile, but it has remained between 14 and 20 trips per person per year since 2002.
In 2023 there were 47 cycling miles per person travelled which was a decrease of 17% compared to the previous year (57 miles per person) and 13% lower than in 2019 (54 miles per person).
Half of public transport trips use a single mode of transport, the remaining half use more than one transport mode. Around 27% of multi-modal public transport trips in England involved more than one public transport mode. Average trips by buses outside London increased by 8% in 2023 compared to 2022 with 25 trips per person. This may have at least partially been impacted by the national £2 bus fare cap which came into effect on buses outside London from January 2023 under the previous government.
In 2023, average trips increased for both car drivers and passengers to 363 trips per person and 185 trips per person respectively, however, these remained below pre-pandemic levels. Car driver was the most frequent mode to begin a trip, with 39% of trips. Females made more car trips than males, however, males made longer car journeys than females.
Commuting Outside London, residents in England relied on cars for commuting, with 70% of commuting trips made by car by residents from urban areas outside London, and this increased to 81% by residents in rural areas (excluding London).
TransportXtra is part of Landor LINKS
![]()
© 2026 TransportXtra | Landor LINKS Ltd | All Rights Reserved
Subscriptions, Magazines & Online Access Enquires
[Frequently Asked Questions]
Email: subs.ltt@landor.co.uk | Tel: +44 (0) 20 7091 7959
Shop & Accounts Enquires
Email: accounts@landor.co.uk | Tel: +44 (0) 20 7091 7855
Advertising Sales & Recruitment Enquires
Email: daniel@landor.co.uk | Tel: +44 (0) 20 7091 7861
Events & Conference Enquires
Email: conferences@landor.co.uk | Tel: +44 (0) 20 7091 7865
Press Releases & Editorial Enquires
Email: info@transportxtra.com | Tel: +44 (0) 20 7091 7875
Privacy Policy | Terms and Conditions | Advertise
Web design london by Brainiac Media 2020